When winter storms roll in, I find myself refreshing forecasts, texting neighbors, and wondering: Will school be canceled tomorrow? A snow day calculator promises to answer that question with a probability score, blending weather data, local context, and historical patterns. In this guide, I unpack how these tools work, where they shine, where they stumble, and how to get the most value from them without treating them as crystal balls.
How a Snow Day Calculator Works
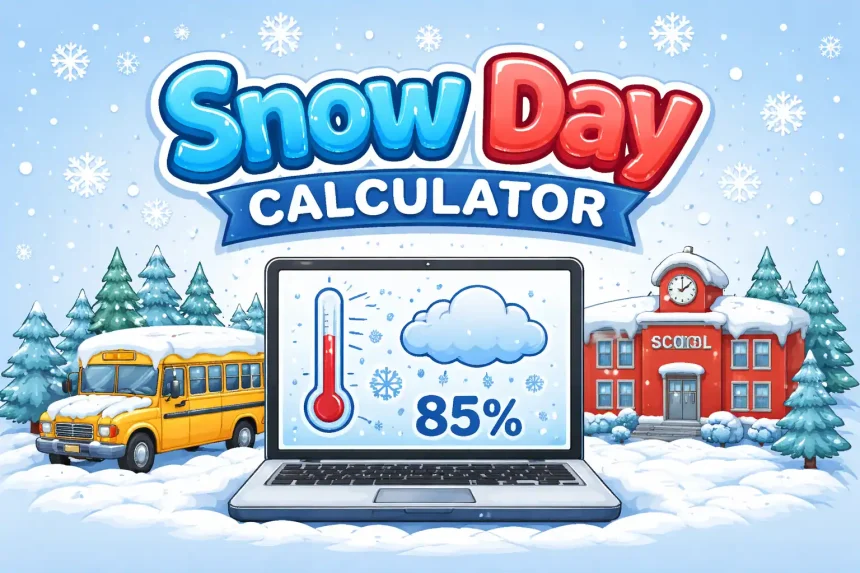
A snow day calculator estimates the chance of school or workplace closures by combining three pillars of information: meteorology, local response norms, and history. While implementations differ, most follow a similar flow from raw data to a clear, user-facing percentage.
1) Meteorological Inputs
- Forecast snowfall totals (hourly and storm-total)
- Precipitation type and rate (snow, sleet, freezing rain)
- Temperatures at the surface and aloft (critical for snow-liquid ratios and icing)
- Wind speed and gusts (drifts, whiteouts, tree damage)
- Timing (overnight vs. daytime) and storm duration
- Road surface and soil temperature, when available
I think of these as the physics of the storm—the baseline hazards that any district must contend with. Modern calculators often pull from multiple forecast models to reduce single-model bias and create a consensus view.
2) Local Logistics and Tolerance
- District closure thresholds (explicit or inferred)
- Plow capacity and priority routes
- Rural vs. urban bus routes (distance, elevation, microclimates)
- Start times (early bus pickups increase sensitivity to overnight snow)
- Availability of staff and substitute teachers
These inputs reflect how your community tends to respond. Two inches in one city could mean business as usual, while in another it shuts everything down. Some calculators let me fine-tune these assumptions through short questionnaires or ZIP code selection.
3) Historical Patterns and Feedback
- Past closures given similar conditions
- Storm outcome archives for the region
- User-reported closures that refine the model over time
By learning from what actually happened, a snow day calculator can adjust its thresholds. This doesn’t guarantee perfection—rare ice events or freak blizzards still surprise the model—but it nudges probabilities toward realism.
The Modeling Brain: From Data to Probability
Under the hood, there are a few common approaches.
Ensemble Blending
Calculators ingest multiple weather models (e.g., global and regional) and blend them, often via weighted averages based on recent performance. This ensemble smooths outliers and produces a central estimate for snowfall, icing, and wind impacts.
Logistic or Gradient Models
Once hazards are quantified, statistical models (logistic regression, gradient boosting, or random forests) translate inputs into closure likelihood. Features like “snowfall during bus hours” or “freezing rain above 0.1 inch” get outsized weight because they correlate strongly with cancellations.
Rule Layers and Overrides
Because human decisions are messy, many tools layer rules over the statistics. Examples:
- If forecast ice accretion exceeds a threshold, push the probability sharply higher
- If the storm ends by midnight and temps rise above freezing by dawn, reduce the score
- If wind gusts pass a local threshold while snow remains moderate, maintain elevated risk for drifting and power outages
This hybrid approach captures both pattern recognition and local common sense.
Accuracy: What to Expect (and What Not To)
I temper my expectations with three realities:
Forecast Uncertainty
Weather models are error-prone at fine scales—especially with precipitation type. A small shift in temperature layers can flip a snowstorm to an ice event or a cold rain, dramatically changing closure decisions. Expect sharper forecasts 24–36 hours before the event, with large swings possible earlier.
Human Decision Factors
Superintendents juggle liability, parent logistics, staff availability, and public safety. Two neighboring districts can make opposite calls under the same conditions. Calculators can mimic patterns but not read minds. Treat a 60% chance as “leaning likely,” not a promise.
Microclimates and Infrastructure
Hills, lake-effect bands, coastal fronts, and urban heat islands can skew outcomes neighborhood by neighborhood. Calculators anchored to airport data may miss street-level realities. Look for tools that integrate radar nowcasting and road condition sensors where available.
How to Use a Snow Day Calculator Wisely
I treat it as one input among several. Here’s a simple playbook:
24–48 Hours Before
- Check the probability trend each model run (typically every 6–12 hours)
- Read the narrative discussion if provided—reasoning matters as much as the number
- Compare with official forecasts and school communications
The Evening Before
- Prioritize the timing of heaviest precipitation vs. commute windows
- Watch for mixed-precip or ice flags; those move the needle faster than fluffy snow
- Consider after-school impacts; early dismissals and activity cancellations often precede full closures
The Morning Of
- Scan radar and traffic cams; verify conditions match expectations
- Re-check temps and wind chills for bus-stop safety
- Refresh the calculator; many re-weight to nowcasting after daybreak
Key Inputs You Can Control
Some calculators let me customize:
Location Precision
Entering a precise address or neighborhood can improve results, especially in hilly or lake-effect regions.
School Start Time and Bus Routing
Shifting these fields changes the overlap between peak impacts and the commute window, often the decisive factor.
Risk Tolerance
A slider for conservative vs. cautious districts helps mirror local decision culture. If your district rarely closes, dial it down; if it’s safety-first, nudge it up.
Common Myths, Debunked
“The higher the snow total, the higher the chance.”
Not always. Three inches of snow topped with a thin glaze of ice can be far worse than eight inches of powder. Timing and type beat totals.
“It’s always right by bedtime.”
Evening updates may still be juggling model disagreements. Midnight and pre-dawn runs often settle the picture. Don’t over-commit too early.
“My district closed last time at four inches, so it will again.”
Context changes—road salt availability, staffing, wind, and temperature can all tip the scales differently.
Building Your Own Mini Calculator (Optional Geek-Out)
If you’re curious, you can approximate a simple version:
Inputs
- 6–12 hour snowfall during commute window (inches)
- Any freezing rain forecast (binary)
- Wind gusts during commute (mph)
- Overnight low temperature (°F)
Simple Scoring Idea
- Start at 0
- Add 8 points per inch of commute-window snow (cap at 60)
- Add 25 points if any freezing rain is forecast
- Add 1 point per mph of gusts above 25 (cap at 15)
- Add 10 points if low is below 10°F
Map 0–100 to a probability scale. It’s crude, but you’ll see how timing and ice dominate.
What Makes a Great Snow Day Calculator
- Clear, friendly explanations beside the number
- Transparent sources and update cadence
- Local tuning (start times, bus routes, rural/urban mix)
- Blended model guidance with nowcasting handoffs
- Mobile-first design and fast refresh
When a tool checks those boxes, I trust its trends, even if I still keep an eye on the sky.
Bottom Line
A snow day calculator is best used as an informed nudge, not a verdict. Pair its probability with official alerts, local communications, and your own observations. Winter weather is unruly—but with the right context, you can trade guesswork for good planning and a little peace of mind.